
Do you want to be informed on new Posts on this Thread? (members only)
| S&S Swan General - S&S Swan Figures of Merit |
|---|
|
Join Date: 30 January 2007
Posts: 467 |
||
|---|---|---|
|
Kendall, |
|
Join Date: 17 November 2009
Posts: 46 |
||
|---|---|---|
|
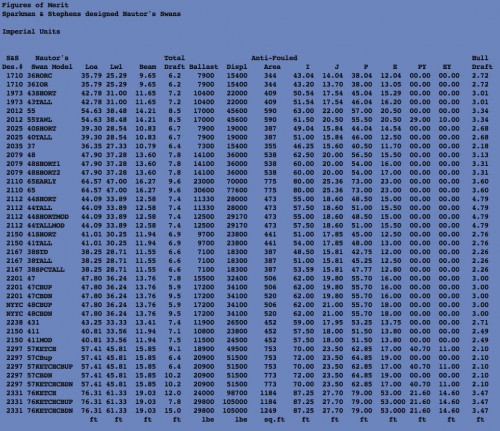
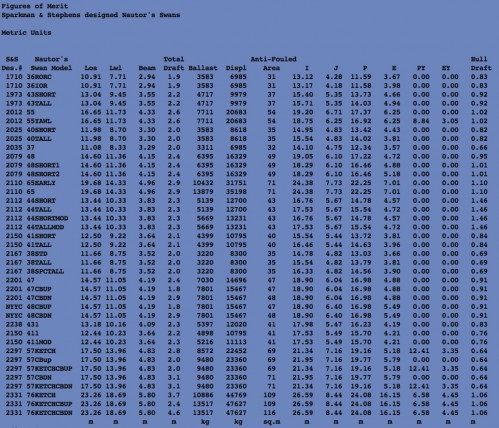
All,
  |
|
Join Date: 17 November 2009
Posts: 46 |
||
|---|---|---|
|
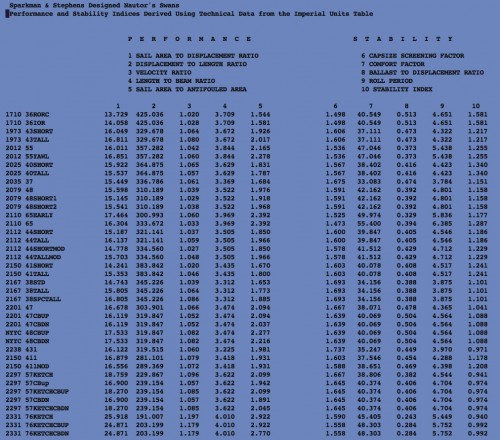
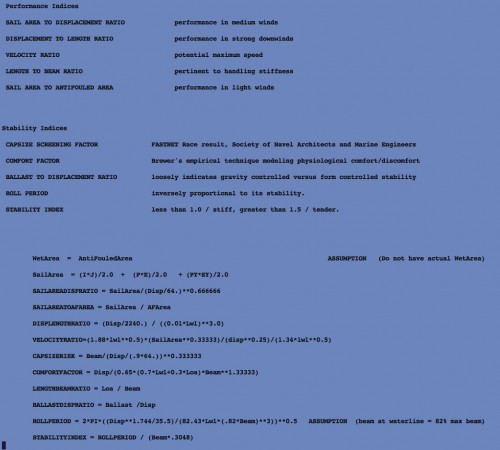
All,
  |
|
Join Date: 17 November 2009
Posts: 46 |
||
|---|---|---|
|
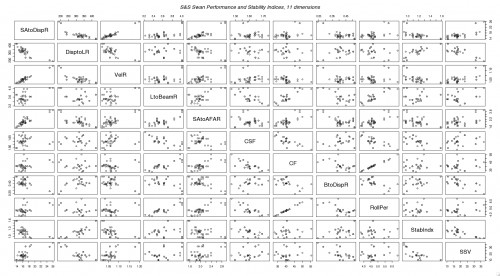
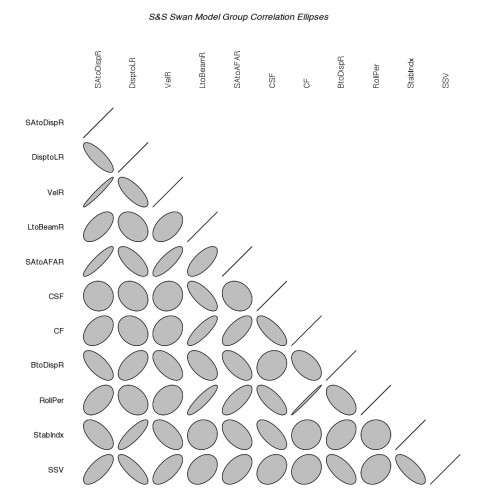
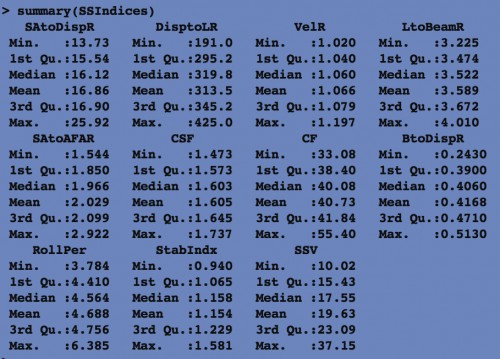
The stability screening value (SSV) from the US sailing website mentioned in the previous note was added to the table of indices.
Now there are a total of eleven (11) indices calculated (5 performance, 6 stability)
  |
|
Join Date: 17 November 2009
Posts: 46 |
||
|---|---|---|
|
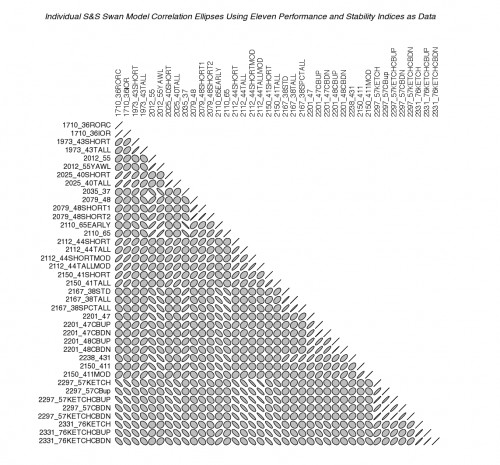
In the last message, there was a mistake. There are 39 models/configurations listed on the Figure of Merit tables, not 37 as was mentioned.
  |
|
Join Date: 17 November 2009
Posts: 46 |
||
|---|---|---|
|
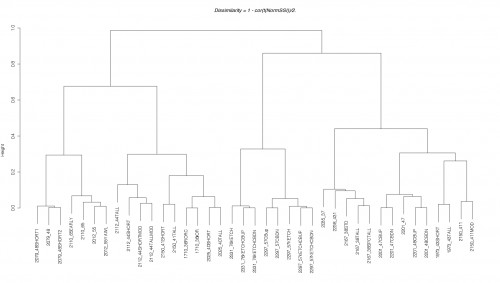
Attached, is the result of applying a hierarchical clustering algorithm to the correlation matrix derived from the normalized data. This method partitions the S&S Swan models into various groups. Its the intent of the method to produce groups having members that are similar to each other (and dissimilar from members in other groups).
 |
|
Join Date: 04 March 2007
Posts: 41 |
||
|---|---|---|
|
OK, SO WHAT NOW? WHAT DOES THIS MEAN? DO WE ALL SELL OUR BOATS AND BUY OTHERS IF SO WHICH ONES? A PRESTO PIPPO 411/22 |
|
Join Date: 17 November 2009
Posts: 46 |
||
|---|---|---|
|
Pippo,
|
|
Join Date: 17 November 2009
Posts: 46 |
||
|---|---|---|
|
Histograms of each of the eleven (performance/stability) indices are presented below. Each histogram shows the distribution of the 39 S&S Swan models for the various indices. By looking up your model's eleven indices (listed a few messages prior), you can determine how your model compares to all other S&S Swans. I'll show the Model 431 comparison next. 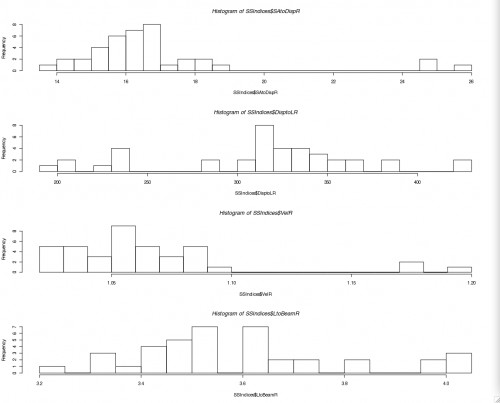 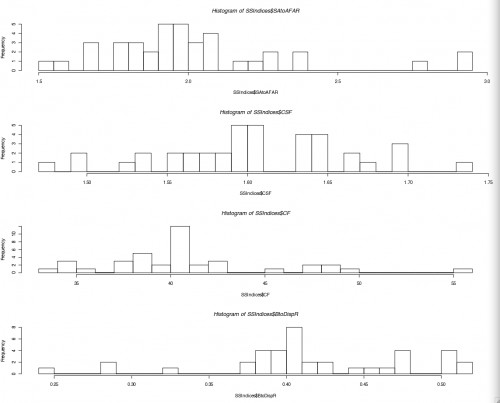 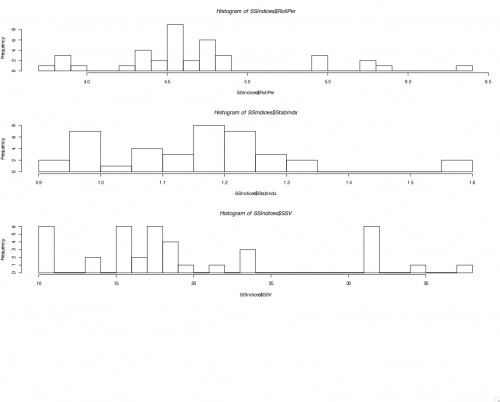 |
|
Join Date: 17 November 2009
Posts: 46 |
||
|---|---|---|
|
Model 431 summary: 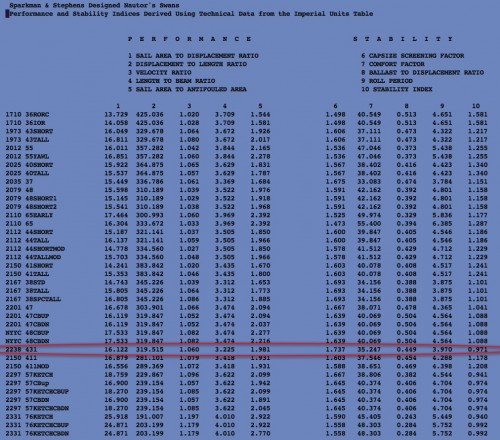 |
|
Join Date: 17 November 2009
Posts: 46 |
||
|---|---|---|
|
Model 431 locations on the distributions of the performance and stability indices. 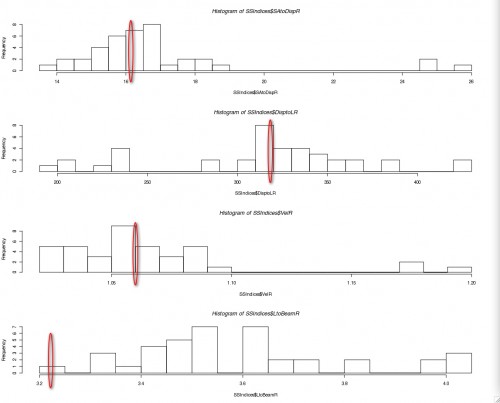 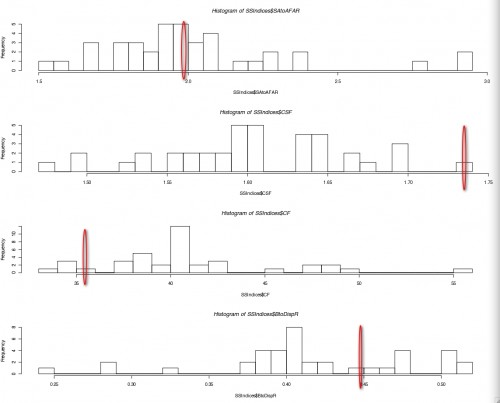 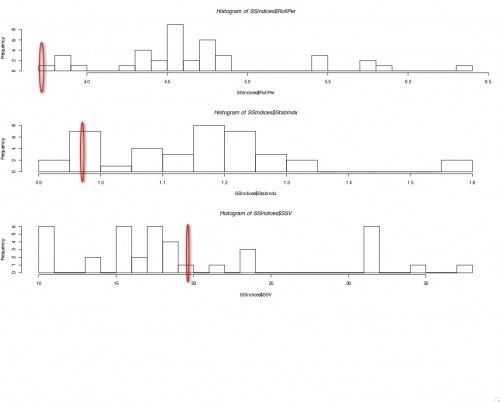 |
|
Join Date: 17 November 2009
Posts: 46 |
||
|---|---|---|
|
The two clusters discussed in message #27 of this thread are indicated below using ovals and rectangles to show the cluster memberships. Since the ordering of the models in the listing are chronological, the clusters represent groupings based on early models (ellipses) and later models (rectangles). The cluster algorithm determined this grouping solely on the basis of the information in the performance and stability indices matrix. 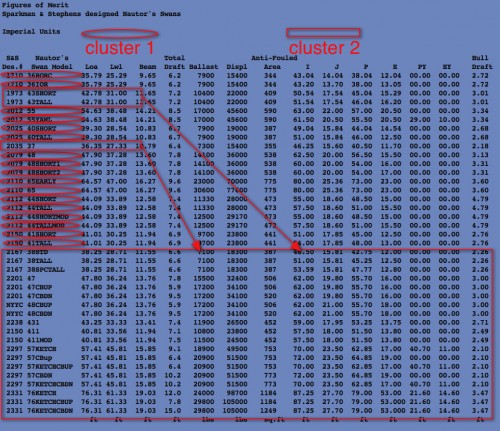 |
|
Join Date: 17 November 2009
Posts: 46 |
||
|---|---|---|
|
Histograms using color to display the locations of the Velocity Ratio and the Stability index are presented below. The cluster analysis partitioned the S&S Swan models into two major groups that I opted to associate with the names of "early" Swans and "late" Swans. 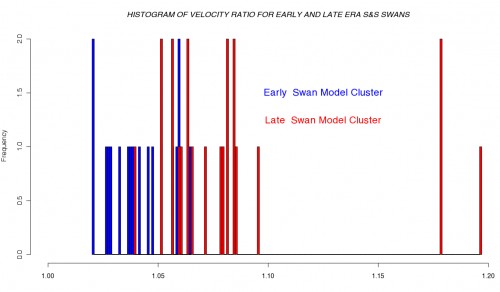 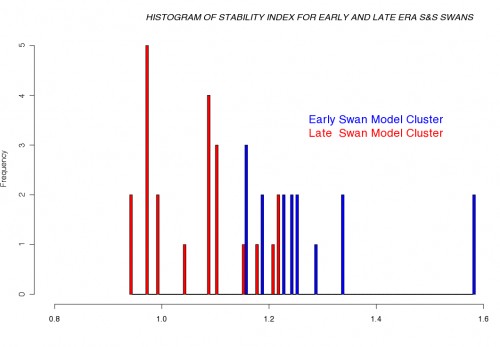 |
|
Join Date: 17 November 2009
Posts: 46 |
||
|---|---|---|
|
Contrastingly, other indices seem to offer little discriminating power to separate the "early" and "late" Swan clusters from each other. The histograms below show the distributions of the Beam to Displacement Ratio and Sail Area to Anti-Fouled Area Ratio. The central tendency of both of the clusters seem to overlap each other in these cases (red and blue shares approximately the same locations along the x-axis). 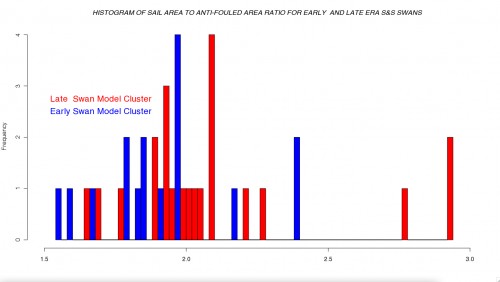 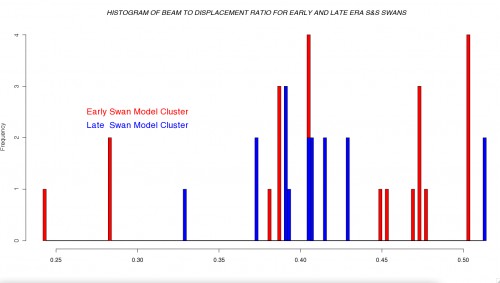 |
- Threads : 1804
- Posts : 10761
- Members: 862
- Online Members: 0
